
Bitcoin enthusiasts are always looking for new tools and charts to help them navigate the rough waters of the cryptocurrency market.
Although there is no perfect indicator, the sum of tools that we provide you on this website will help you to have more information in your decision-making as an investor. One such chart that has gained popularity over the years is the Bitcoin Rainbow Chart, which reflects the volatility and momentum of this cryptocurrency. In this article we will delve into its history, how to interpret it and its relevance in the crypto world.
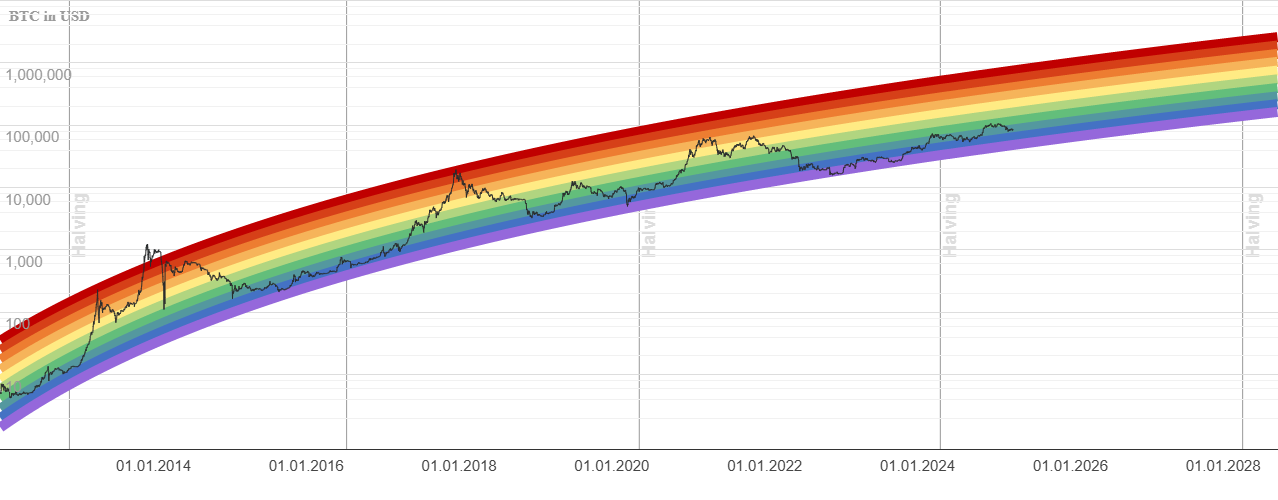
This is Today’s Bitcoin Rainbow Price Chart
The Bitcoin Rainbow Chart Unveiled
This is not your typical price chart. It is not a tool to trade in the short term or to predict immediate movements in the price of Bitoin. Instead, it is a long-term investment chart that provides a visual representation of the historical performance of this cryptocurrency.
History and Origins: It was created by Reddit user u/azop in early 2014, inspired by a similar chart used in the precious metals market to gauge the cycles of boom and bust. The chart gained popularity on the r/Bitcoin subreddit and quickly became a reference point for long-term investors.
How does it work?
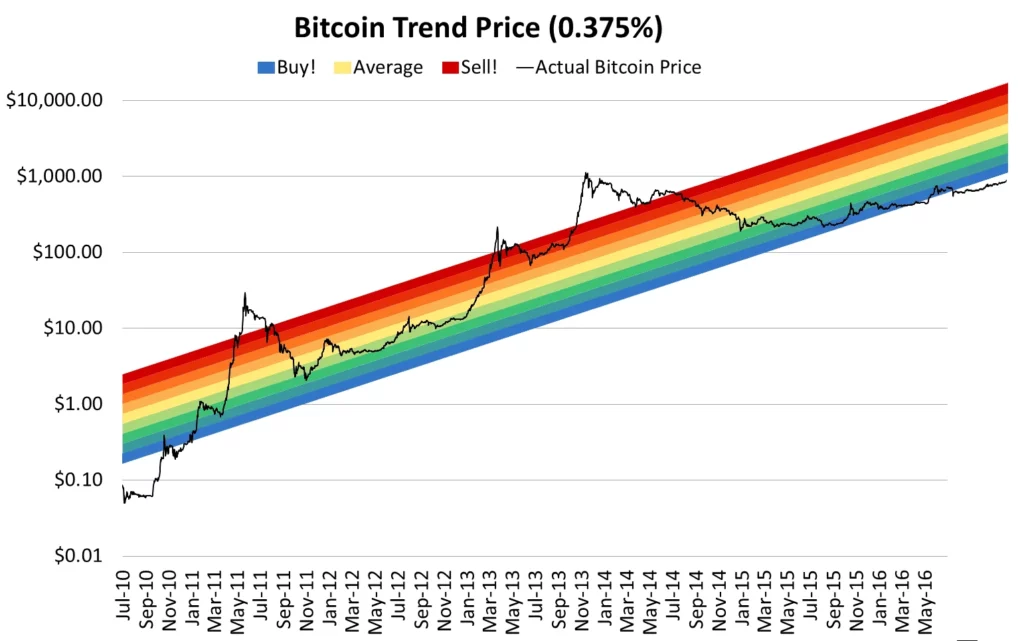
It is a relatively simple tool to understand. It consists of a series of concentric colored rings, each representing a different price range for Bitcoin. The colors range from red to purple, where red indicates undervaluation and purple overvaluation.
Here’s a breakdown of how the chart works:
- Colored Bands : The chart has seven colored bands, each representing a 35x increase in the price of Bitcoin. For example, the red band represents the lowest price range, from $0 to $500. The purple band represents the highest range, starting at $100,000 and up.
- Data Points: Within each band, there are specific data points that indicate the historical prices of the cryptocurrency. These data points are represented by dots on the graph. The points move along the bands as the price evolves.
- Long-Term Outlook: The chart is designed to provide a long-term perspective on Bitcoin price movements. You are not concerned with daily or even yearly fluctuations. Instead, it offers a holistic view of how it has performed over time.
Interpreting the Rainbow
It is a relatively simple tool to understand. It consists of a series of concentric colored rings, each representing a different price range for Bitcoin. The colors range from red to purple, where red indicates undervaluation and purple overvaluation.
Here’s a breakdown of how the chart works:
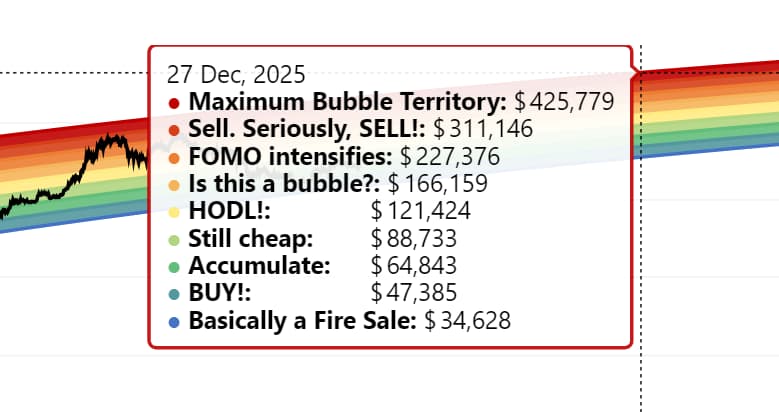
- Colored Bands: The chart has seven colored bands, each representing a 35x increase in the price of Bitcoin. For example, the red band represents the lowest price range, from $0 to $500. The purple band represents the highest range, starting at $100,000 and up. Therefore the interpretative reading of the colors would be:
Blue: BTC is on a liquidation sale. Safe purchase!
Teal: You have to buy BTC.
Green: Cheap accumulated buy zone
Light green: The price is still cheap
Yellow: Hold BTC. Do not move.
Light Orange: Are we entering crypto bubble territory?
Dark orange: FOMO intensifies.
Red: You have to sell BTC.
Dark red: Maximum territory of the crypto bubble.
- Data Points: Within each band, there are specific data points that indicate the historical prices of the cryptocurrency. These data points are represented by dots on the graph. The points move along the bands as the price evolves.
- Long-Term Outlook: The chart is designed to provide a long-term perspective on Bitcoin price movements. You are not concerned with daily or even yearly fluctuations. Instead, it offers a holistic view of how it has performed over time.
Bitcoin Rainbow Chart vs. Other Crypto Charts
| Chart Type | Purpose | Timeframe | Use Case |
|---|---|---|---|
|
Bitcoin Rainbow Chart |
Long-term investment perspective |
Years/Decades |
Identify cycles of over/undervaluation |
|
Candlestick Chart |
Short-term trading and analysis |
Minutes/Hours |
Predict short-term price movements |
|
Line Chart |
Historical price tracking |
Months/Years |
Analyze overall price trends |
|
Moving Averages |
Smooth out price data for trends |
Variable |
Identify potential buy/sell signals |
In Practice: An Example
Let’s take as an example a long-term Bitcoin investor who has been monitoring the Bitcoin Rainbow Chart. He notes that the crypto has entered the yellow band, which historically means a strong bull market. This could bolster your confidence in keeping your investments in the long term.
On the contrary, if he sees that Bitcoin enters the blue or purple bands, it may make him think. While it doesn’t necessarily mean an immediate drop, it could suggest a period of overvaluation, prompting you to consider taking some profit or diversifying your portfolio.
In any case, from here we always recommend averaging purchases or sales in order to obtain the most optimal price possible. You will never be able to buy at the lowest price or sell at the highest price 😉
If you have any questions, you can also watch this explanatory video that gives a very good summary of the graph. We found it lovely!